
The Object Cost Report provides a comparison of the operating cost of selected vehicles or tracking objects across different periods. It helps users understand the cost per distance, cost per day, and cost per hour for the current month, previous month, and the month before that.
The report is useful for comparing object-level costs over time and identifying changes in operating expenses.
Benefits
- Compare vehicle costs across different months.
- Analyze cost per distance, day, and hour.
- Identify changes in operating costs over time.
- Compare the cost performance of multiple objects.
- Review cost trends to support fleet cost analysis.
How to Access
- Report-->Expense-->Object Cost
Filters
Use the available filters to generate the report: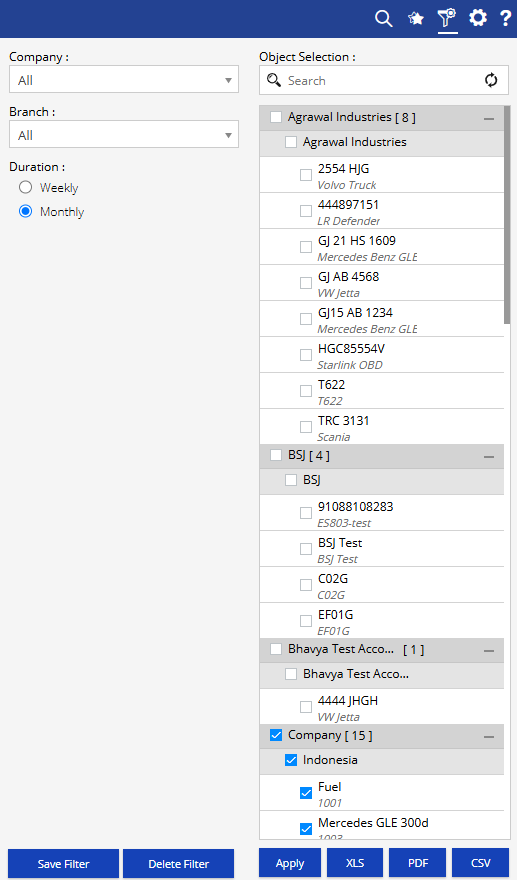
- Company: Select the required company.
- Branch: Select the required branch.
- Duration: Select the reporting duration:
- Weekly
- Monthly
- Object Selection: Select the required vehicles or tracking objects.
Additional options include Save Filter, Delete Filter, Apply, XLS, PDF, and CSV.
Report Layers
The Object Cost Report has one level of information: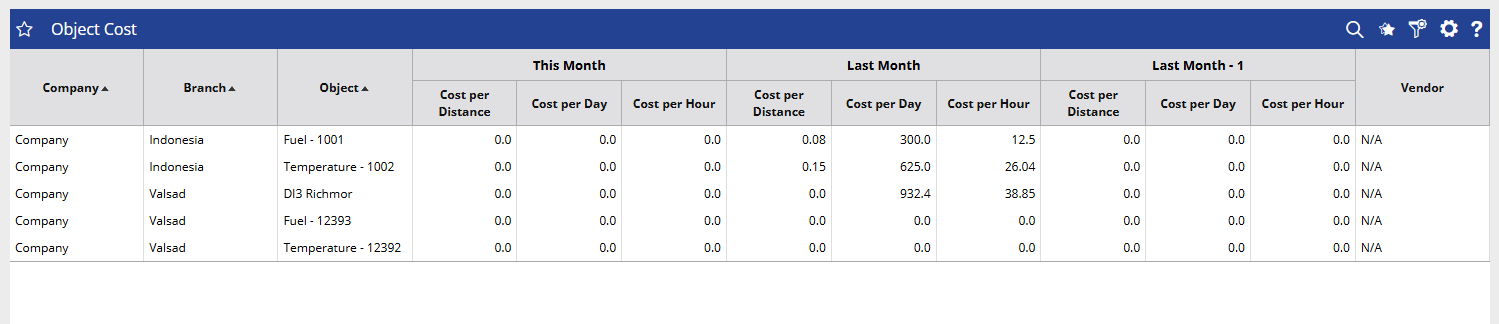
Object Cost
Displays the cost comparison for each selected object across the current month, previous month, and the month before the previous month.
How to Read
Object Cost
- Company identifies the company associated with the object.
- Branch shows the branch to which the object belongs.
- Object identifies the vehicle or tracking object for which the cost is calculated.
- This Month – Cost per Distance shows the cost incurred per unit of distance during the current month.
- This Month – Cost per Day shows the average cost incurred per day during the current month.
- This Month – Cost per Hour shows the cost incurred per operating hour during the current month.
- Last Month – Cost per Distance shows the cost incurred per unit of distance during the previous month.
- Last Month – Cost per Day shows the average cost incurred per day during the previous month.
- Last Month – Cost per Hour shows the cost incurred per operating hour during the previous month.
- Last Month -1 – Cost per Distance shows the cost incurred per unit of distance during the month before the previous month.
- Last Month -1 – Cost per Day shows the average cost incurred per day during that month.
- Last Month -1 – Cost per Hour shows the cost incurred per operating hour during that month.
- Vendor displays the vendor associated with the object, where available.
Take Action
- Select the required company, branch, and objects to focus the analysis.
- Choose Weekly or Monthly duration according to the required reporting period.
- Compare Cost per Distance across months to identify changes in distance-based operating costs.
- Review Cost per Day to understand the daily cost associated with each object.
- Compare Cost per Hour to analyze hourly operating costs.
- Review the current month against Last Month and Last Month -1 to identify cost trends.
- Export the report in XLS or PDF format for further analysis or sharing.
Important Notes
- Cost values are calculated based on the expense and operational data available for the selected objects and reporting period.
- Cost per Distance, Cost per Day, and Cost per Hour may vary depending on the available distance and time data.
- The comparison periods are displayed relative to the selected reporting duration.
- If an object has no applicable cost or operational data for a period, the corresponding value may be displayed as 0.0.
- Vendor information is displayed when it is available for the selected object.