
The Today Activity report provides a real-time operational overview of all tracked vehicles/assets for the current day. It combines a graphical summary section with detailed vehicle-level activity records. The report enables fleet managers to monitor vehicle status, utilization, location, running performance, and sensor conditions from a single dashboard.
Please Note: This report is available Trakzee Standard, Trakzee Premium & Smart Waste.
Before You Get Started
- This report uses data from multiple sensors. All relevant sensors must be connected to ensure the report displays complete data.
- The Following sensors needs to be connected.
- The Report shows data related to Alert count, Geofence & Nearest Address.
- Alert: Displays the total number of alerts generated by the vehicle during the reporting period. Data will appear in this column only when alert configurations have been properly set up for the vehicle
- Geofence: Displays the name of the geofence in which the vehicle is currently located, Geofence creation is required for this field to display a geofence name.
- Address: Displays the nearest address or location configured in the software based on the vehicle's current location. The address must be added in the software to appear in this column.
Please Note:
To know more about Alert, Click here.
To Know more about Geofence, Click here.
To know more about Address, Click here.
To Open Today's Activity Report.
- Log in to your account.
- Go to Reports > Activity > Today's Activity.
The Report loads automatically without requiring vehicle selection and displays data for all vehicles by default.
- The Following Report will Load.
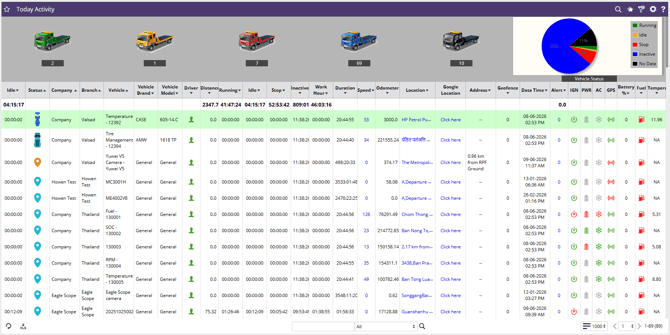
Report Explanation
The top section displays vehicle status using color-coded vehicle icons and a pie chart. The vehicle icons represent different vehicle statuses, while the pie chart provides a visual summary of the vehicle distribution based on those statuses.
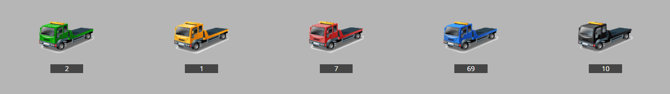
- Vehicle Icon.
-
The colored vehicle icons represent different operational statuses, the count of no of vehicle for the status is just below the icon.
-
Green: Vehicles currently Running/operating.
-
Yellow: Vehicles engine ON but stationary.
-
Red: Vehicles stopped/Engine Off.
-
Blue: Vehicles not reporting or disconnected from the server.
-
Grey: Vehicles that have not sent even a single data packet to the server.
-
-
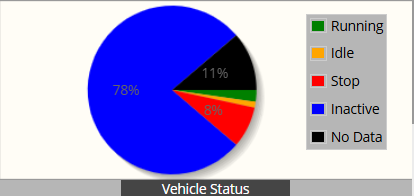
- Pie Chart.
-
-
Pie Chart provides a graphical representation of fleet distribution by status:
-
Running
-
Idle
-
Stop
-
Inactive
-
No Data
-
-
- Rows & Column

-
- The report data is displayed in a tabular format consisting of rows and columns. The description of each column is provided below.
- Idle: Total accumulated idle time for the vehicle during the selected day.
- Status: Current operational status of the vehicle.
- Company: Company under which the vehicle has been added.
- Branch: Branch under which the vehicle has been added.
- Vehicle: Vehicle name & Plate No added during vehicle configuration.
- Vehicle Brand: Vehicle brand (Manufacturer) selected during vehicle configuration.
- Vehicle Model: Vehicle model selected during vehicle configuration.
- Driver: Current Driver assigned to the vehicle.
- Distance: Displays the total distance traveled by the vehicle when report is generated.
- Running: Displays the total Movement time of the vehicle when report is generated. (IGN= ON & Speed > 5 )
- Idle: Displays total time the vehicle remained stationary with ignition ON when report is generated. (IGN= ON & Speed < 5 )
- Stop: Displays total time the vehicle remained stationary with ignition OFF when report is generated. (IGN= OFF)
- Inactive: Displays total time the vehicle didn't send data when report is generated.
- Work Hour: Total time vehicle was operational (Running + Idle).
- Duration: Displays the time duration for which the vehicle has remained in its current status.
- Speed: Displays the current speed of vehicle, if the speed is above the overspeed alert than it will flash in Red Color.
- Odometer: Displays total odometer value.
- Location: Displays the current vehicle address from the map. Click on the address to view it on Map.
- Google Location: Click to show the current location on google maps (Google Map API required).
- Address: Shows the distance of the vehicle from configured Address in the software. (limited to 2KM)
- Geofence: Displays the name of the geofence in which the vehicle is currently located.
- Date & Time: Displays the date and time when the most recent data packet was received from the vehicle.
- Alert: Displays the total no of alerts generated by the vehicle. Hover on the Number to see the alert details.
- IGN: Displays current Ignition status.
- PWR: Displays current power status.
- AC: Displays current AC status.
- GPS: Displays current GPS status.
- Battery%: Displays Internal battery in percentage.
- Fuel: Displays current fuel value.
- Temperature: Displays current temperature value.
- The report data is displayed in a tabular format consisting of rows and columns. The description of each column is provided below.
Additional Features:
The report includes additional features and actions for easier analysis and navigation. To learn more about these features, click here.