
Reports in a Vehicle management system provide a structured summary of data and insights related to vehicle activity, performance, and usage. They consolidate and present information in a user-friendly format, enabling better decision-making and operational efficiency.
Please Note: The Report Functionality is only available for Admin, Reseller & related subuser's.
Uses of Reports
- ain insights into current operations for quick decision-making.
- Tailor reports to focus on specific parameters based on business needs.
To Open a Report, click on Menu > Reports in the application and select the preferred report.
Below given is an example of a report:
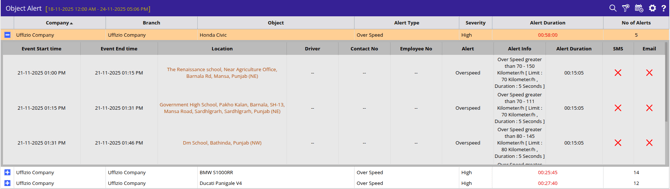
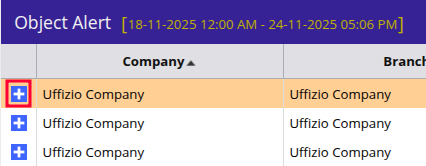
To view the detailed information of a single object, click on + as highlighted in the below-given image:
Detailed information about that particular object will be viewed as shown in the image given below: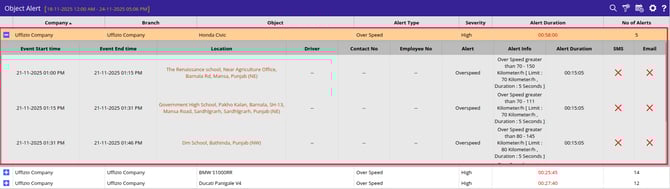
To properly access the Detailed report, you can simply double-click on the object within the Summary report.
Customize Report Data
Users can easily customize the report outputs to their specific needs by applying filters such as date range, object selection, and other criteria, enabling focused and actionable insights.
To accomplish this, navigate to Reports > Click on the ![]() icon as highlighted option in the image below.
icon as highlighted option in the image below.

Upon clicking on![]() , a tab will appear on the right side of the screen, as illustrated in the image below. Here, users can easily apply the filter for required parameters, allowing them to customize the data they wish to analyze.
, a tab will appear on the right side of the screen, as illustrated in the image below. Here, users can easily apply the filter for required parameters, allowing them to customize the data they wish to analyze.

Upon clicking the apply button, users will be able to view the report tailored to the specified time range and selected objects.
Schedule the Report
Users can set up a schedule for report downloads, which automates the process and eliminates the need for daily manual downloads and streamlines their workflow.
To create a Schedule Report, go to Reports > Click on ![]() as highlighted in the below-given image.
as highlighted in the below-given image.

After clicking on ![]() , the tab will open on the right side of the screen, as shown below.
, the tab will open on the right side of the screen, as shown below.
To create a Schedule Report, click on + Create Schedule Report. The following window will open on the right side of the screen: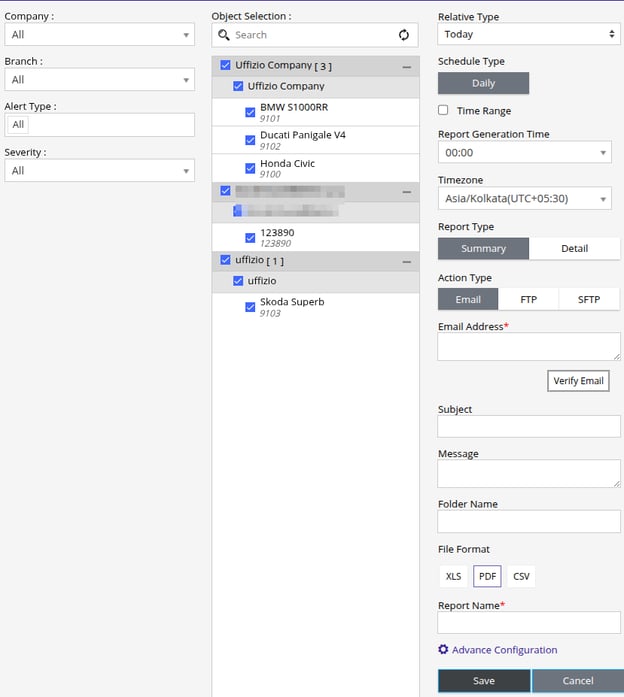
Choose the objects for which you would like to schedule the report, and fill in the additional details according to your requirements and preferences. Once you have completed this, click on Save to create the scheduled report.
Adjust Preferences
Users have the flexibility to customize the report columns that are displayed on-screen or included in downloads, as well as to specify the sorting order of the records according to their individual preferences and requirements.
To select the preferred columns, go to Reports > Click on ![]() as highlighted in the below given image.
as highlighted in the below given image.

After clicking on ![]() , the window as shown in the below-given image will open, from which the users can select if the columns should be showable, printable, or sortable, along with sorting priority and order. Click on the Save 💾 button to save the settings.
, the window as shown in the below-given image will open, from which the users can select if the columns should be showable, printable, or sortable, along with sorting priority and order. Click on the Save 💾 button to save the settings.

Customize Chart Settings
Users have the ability to modify the chart data consideration available in the report columns.
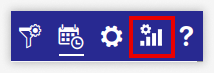
To change the chart setting, go to Reports > Click on ![]() as highlighted in the below-given image.
as highlighted in the below-given image.
After clicking on the highlighted icon, the window as shown in the below-given image will open, from which the users can enter the Header and you can select the field you want to have on X-Axis and Y-Axis respectively. Click on the Save 💾 button to save the settings.
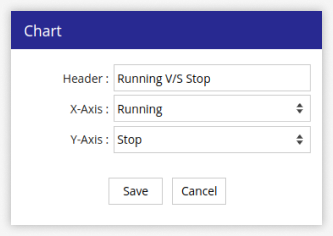
Users will be able to see the chart displayed according to their selections in the report, as illustrated in the image below.
Search Functionality
To search a report or a screen, navigate to the particular Report or Screen and Click on ![]() as highlighted in the below image.
as highlighted in the below image.
-1.png?width=353&height=81&name=Frame%20656%20(1)-1.png)
In the search, you will find all the reports and screens available on the platform.
Simply Search for the desired sceen, and the system will take you directly to the corresponding screen.