
The Distance Vs Alerts Report helps users compare the distance travelled by vehicles with the number of alerts generated during the selected period.
The report provides a summarized view of distance, trips, alert events, alert frequency, average distance per alert, maximum alert type, and risk indication. Users can also open an individual vehicle/object to view the detailed alert events contributing to the summary.
Benefits
- Compare distance travelled with alert frequency.
- Identify vehicles generating frequent alerts.
- Find vehicles with higher alert activity in relation to distance travelled.
- Identify the most frequently occurring alert type for each vehicle.
- Review risk indicators to prioritize vehicles for investigation.
- Drill down into individual alert events for detailed analysis.
How to Access
Path:Reports → Alert → Distance Vs Alerts
Filters
Use the available filters to generate the report:
- Company: Select the required company.
- Branch: Select the required branch.
- Object Group: Select the required vehicle/object group.
- Alert Type: Select the alert type to be considered in the report.
- Alert Per Config: Enter the required alert configuration value.
- Minimum Distance: Enter the minimum distance to be considered for the analysis.
- Trip Calculation For: Select the parameter used for trip calculation, such as Ignition.
- Date Selection: Select the required date or reporting period.
- Time Range: Enable this option to apply a specific time range.
- Object / Driver: Select whether the report should be generated based on objects or drivers.
- Object Selection: Select one or more vehicles/objects.
- Driver Selection: Select the required drivers when the Driver option is selected.
Click Apply to generate the report.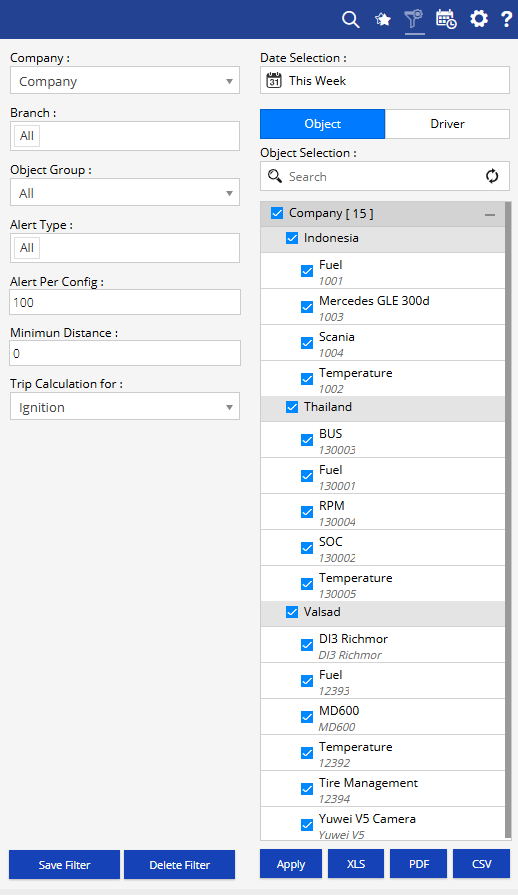
Additional options:
- Save Filter: Save the selected filter combination for future use.
- Delete Filter: Delete the saved filter.
- XLS: Export the report to Excel.
- PDF: Export the report to PDF.
- CSV: Export the report to CSV.
Report Layers
The Distance Vs Alerts Report has two layers:
Layer 1 – Distance Vs Alerts Summary
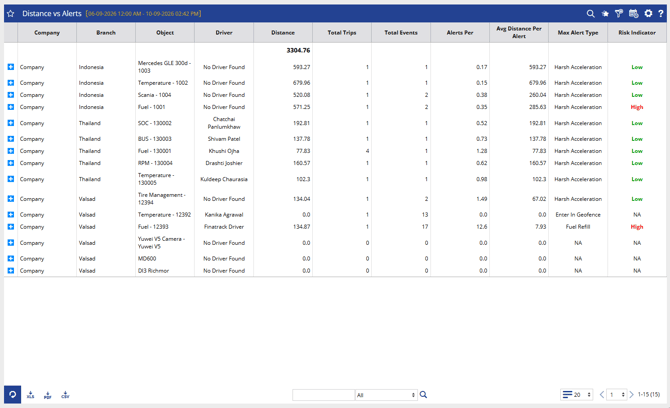
Provides an overall view of distance travelled and alert activity for each vehicle or driver.
- Company: Displays the company associated with the object.
- Branch: Displays the branch associated with the object.
- Object: Displays the vehicle/object for which the analysis is generated.
- Driver: Displays the driver associated with the object, when available.
- Distance: Displays the total distance travelled during the selected period.
- Total Trips: Displays the total number of trips calculated using the selected trip calculation method.
- Total Events: Displays the total number of alert events recorded.
- Alerts Per: Displays the alert frequency in relation to the distance travelled.
- Avg Distance Per Alert: Displays the average distance travelled for each alert event.
- Max Alert Type: Displays the alert type with the highest occurrence.
- Risk Indicator: Displays the risk level based on the configured alert criteria.
Click the + icon against a vehicle to view its individual alert events.
Layer 2 – Distance Vs Alert Detail
Shows the individual alert events contributing to the selected vehicle's summary.
- Date and Time: Displays when the alert event occurred.
- Object: Displays the vehicle/object associated with the alert.
- Driver: Displays the driver associated with the alert, when available.
- Alert Type: Displays the type of alert generated.
- Severity: Displays the severity assigned to the alert.
- Speed: Displays the vehicle speed recorded during the alert.
- Location: Displays where the alert occurred.
- Video Link: Provides the related video reference, when available.
Use the back arrow to return to the Distance Vs Alerts Summary.
How to Read
Read the report from overall distance and alert activity → individual alert events.
Layer 1 – Distance Vs Alerts Summary
- Check Distance to understand how far the vehicle travelled.
- Check Total Events to understand how many alerts were generated.
- Check Alerts Per to understand alert frequency in relation to distance.
- Check Avg Distance Per Alert to understand the average distance associated with each alert.
- Check Max Alert Type to identify the alert type occurring most frequently.
- Check the Risk Indicator to identify vehicles that may require further attention.
Layer 2 – Distance Vs Alert Detail
- Open the vehicle using the + icon.
- Check Date and Time to identify when the alert occurred.
- Review the Alert Type and Severity to understand the nature of the event.
- Check Speed to understand the vehicle speed recorded during the alert.
- Review the Location to identify where the alert occurred.
- Use the Video Link, when available, for further investigation.
Example:
If a vehicle has travelled a significant distance but has generated a relatively high number of alerts, open the Detail Layer to identify the alert types, severity, speed, and locations associated with those events.
Take Action
- Review vehicles with a high number of alert events.
- Compare alert frequency against distance travelled.
- Investigate vehicles showing a High Risk Indicator.
- Identify recurring alert types that may require corrective action.
- Review individual alert locations and speeds for further investigation.
- Use available video links to support event verification.
- Monitor alert trends over different reporting periods.
Important Notes
- The report contains two layers: Distance Vs Alerts Summary → Distance Vs Alert Detail.
- The report results depend on the selected Company, Branch, Object Group, Alert Type, Date, Time Range, and Object/Driver Selection.
- Total Events represents the alert events included based on the selected report criteria.
- Alerts Per and Avg Distance Per Alert help evaluate alert activity in relation to distance travelled.
- Risk Indicator is based on the configured alert criteria.
- The Trip Calculation For option determines how trips are calculated in the report.
- Video Link is available only when the corresponding video information is available.