
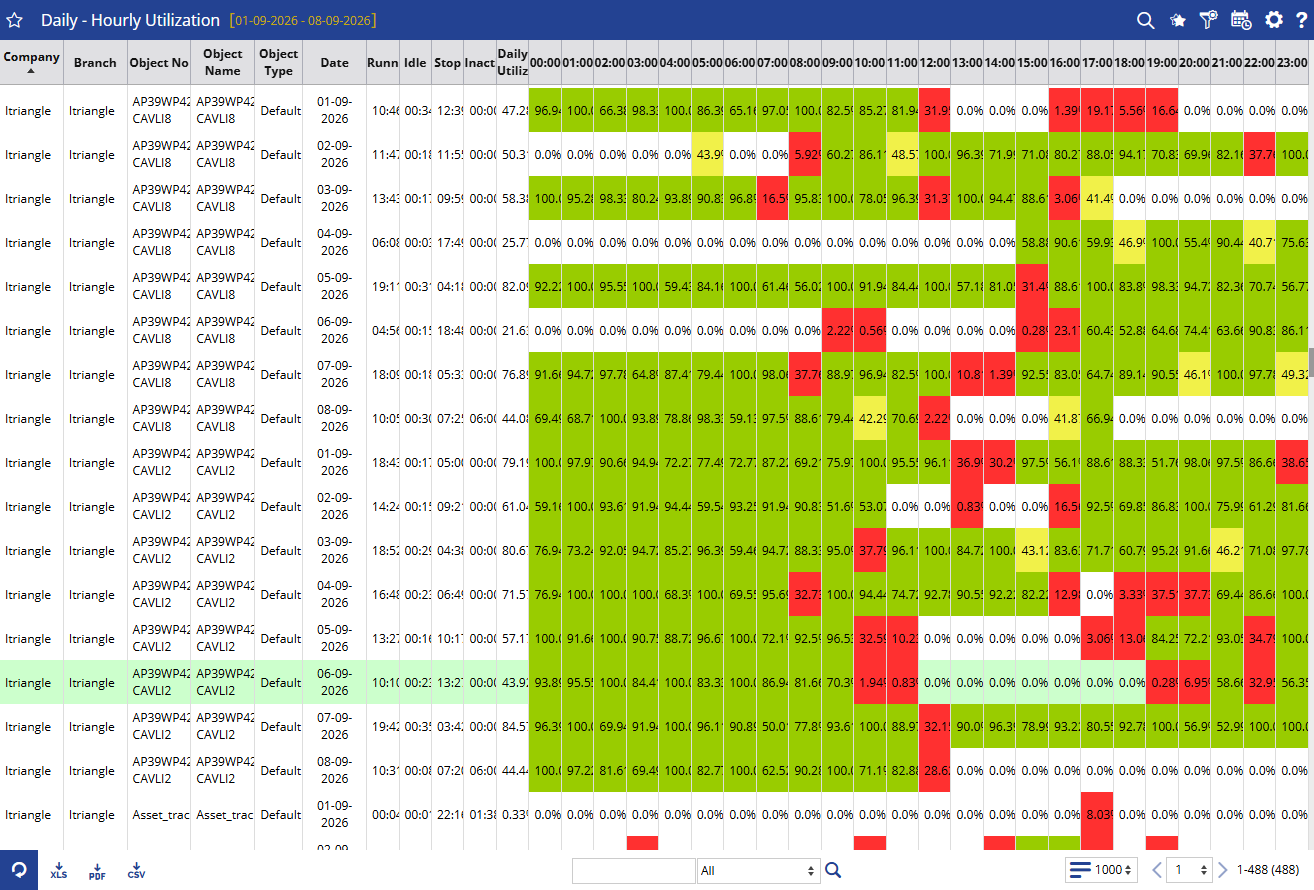
The Daily - Hourly Utilization Report shows how much a vehicle is utilized during each hour of the day over the selected date range.
It helps you understand when vehicles are being used, when they are idle or stopped, and which hours have low or no utilization.
Benefits
- Monitor vehicle utilization throughout the day.
- Identify highly and poorly utilized hours.
- Compare vehicle usage across different days.
- Identify idle periods and opportunities to improve vehicle usage.
- Support better fleet planning based on actual usage patterns.
How to Access
Path:Reports → Activity → Daily - Hourly Utilization
Filters
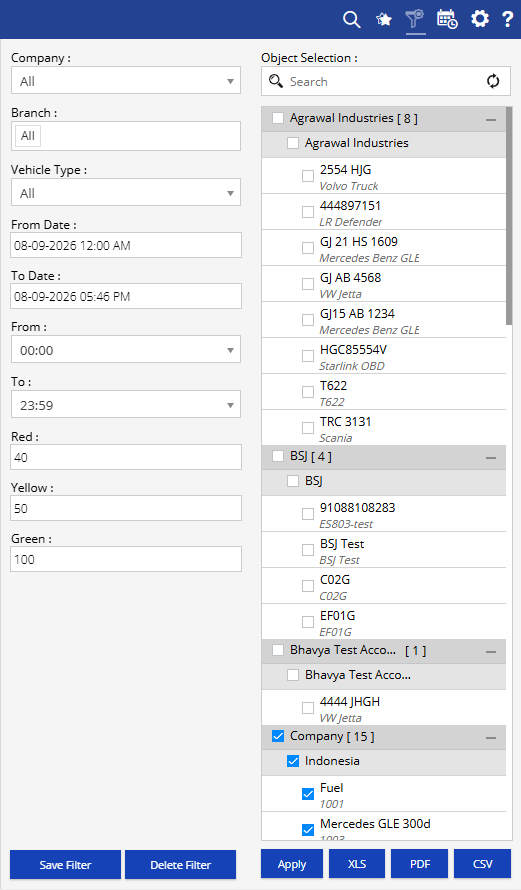
Use the available filters to generate the report:
- Company: Select the required company.
- Branch: Select the required branch.
- Vehicle Type: Select the required vehicle type.
- From Date: Select the starting date.
- To Date: Select the ending date.
- From: Select the starting time.
- To: Select the ending time.
- Object Selection: Select one or more vehicles/objects for the report.
- Click Apply to generate the report.
Additional options:
- Save Filter: Save the selected filter combination for future use.
- Delete Filter: Delete the saved filter.
- XLS: Export the report to Excel.
- PDF: Export the report to PDF.
- CSV: Export the report to CSV.
How to Read
Read the report by looking at vehicle → date → hourly utilization.
- Run, Idle, Stop, and Inactive: Understand how the vehicle's time was distributed during the selected day.
- Daily Utilization: Gives an overall view of the vehicle's utilization for that day.
- Hourly Utilization: Shows the utilization percentage for each hour from 00:00 to 23:00.
- Green cells / higher percentage: Indicate higher utilization during that hour.
- Low or 0% utilization: Indicates that the vehicle had little or no utilization during that period.
Example:
If a vehicle shows 100% utilization from 08:00 to 17:00 and 0% after 18:00, you can understand that the vehicle was primarily utilized during the daytime and had little or no utilization during the later hours.
Take Action
- Identify vehicles that are being underutilized.
- Review hours with low or no utilization.
- Compare utilization across vehicles and days.
- Adjust vehicle allocation based on usage patterns.
- Investigate unexpected periods of inactivity.
Important Notes
- Utilization is displayed as a percentage for the selected date and hourly period.
- The report can be generated for multiple vehicles and multiple days.
- The displayed utilization depends on the selected date, time, vehicle, and other filters.
- The Red, Yellow, and Green values in the filter determine the utilization thresholds used for the report.