
The Dashboard is the central monitoring hub of the Startup application. It provides a real-time snapshot of all vehicles, their operational status, alerts, and geographical distribution on the map. From here, users can quickly understand fleet health and navigate to detailed reports or actions.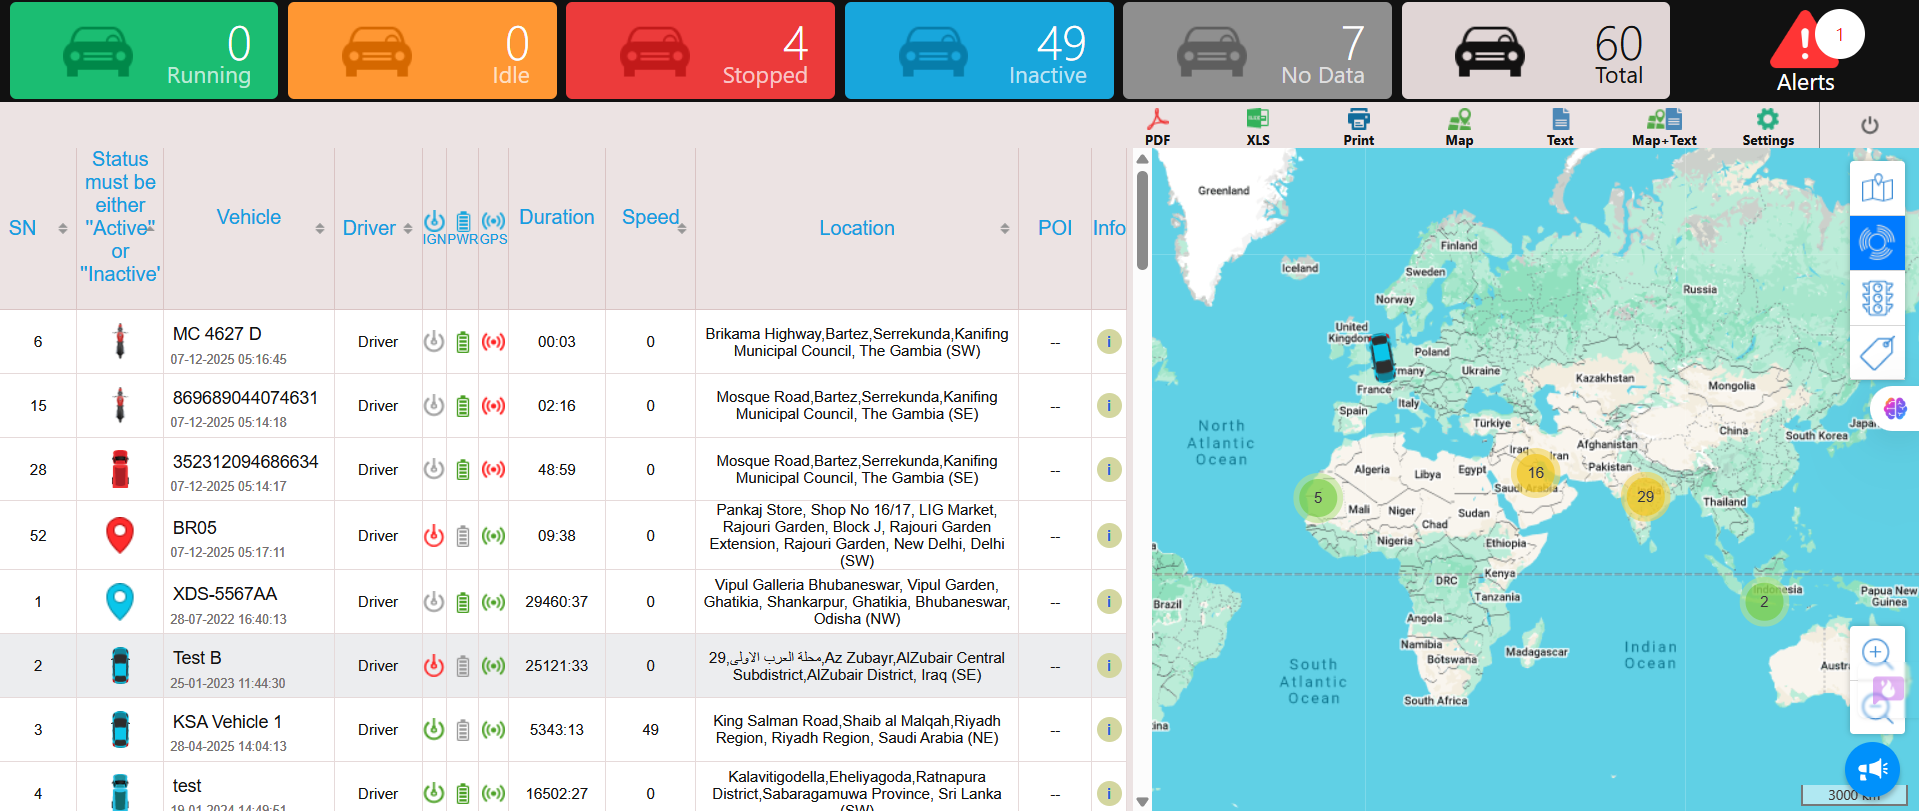
Dashboard Layout
The dashboard is divided into three key sections:
- Vehicle Status Summary Cards
- Vehicle List (Tabular View)
- Live Map View & Export Actions
Vehicle Status Summary Cards
Status cards provide a high-level overview of the fleet. Each card is color-coded for quick identification.
- Running (Green)
Vehicles currently moving and transmitting live data. - Idle (Orange)
Vehicles with engine ON but speed = 0 for a defined duration. - Stopped (Red)
Vehicles with engine OFF. - Inactive (Blue)
Vehicles not communicating with the server beyond the inactivity threshold. - No Data (Grey)
Vehicles with no GPS or device data available. - Total (White/Black)
Total number of registered vehicles in the system.
Alerts Indicator
- Displays the total active alerts generated from all vehicles.
- Clicking alerts navigates to detailed alert information.
Vehicle List – Tabular View
The vehicle list shows detailed, real-time information for each vehicle.
Column Descriptions
- SN
Serial number of the vehicle entry. - Status
Indicates whether the vehicle is Active or Inactive. - Vehicle
Vehicle name or registration number. - Driver
Assigned driver name (if configured). - IGN (Ignition)
Shows ignition ON/OFF status. - PWR (Power)
Indicates external power or battery connection. - GPS
Displays GPS signal availability. - Duration
Time since the last state change (running/idle/stopped). - Speed
Current vehicle speed (km/h). - Location
Latest known address converted from GPS coordinates. - POI
Point of Interest reference, if mapped. - Info
Click the info (i) icon to view detailed vehicle data such as device info, last communication time, and sensor status.
Notes
- Vehicles are updated in near real-time.
- Sorting is available on most columns.
- Status must be either Active or Inactive to appear correctly.
Map View
The map provides a global and regional visualization of all vehicles.
Features
- Clustered Markers – Vehicles close to each other appear as numbered clusters.
- Color-coded Icons – Icons reflect vehicle status (running, stopped, inactive, etc.).
- Zoom Controls – Zoom in/out for detailed location view.
- Vehicle Click Action – Clicking a marker shows vehicle details and last status.
Export & Action Options
Located above the map:
- PDF – Export dashboard or vehicle data as a PDF report.
- XLS – Download vehicle data in Excel format.
- Print – Print the current dashboard view.
- Map – Show only the map-based view.
- Text – Show only the tabular vehicle list.
- Map + Text – Show both map and list view together.
- Settings – Configure dashboard preferences and display options.
The Startup Dashboard offers a complete real-time and visual overview of fleet operations. By combining status cards, detailed tables, and an interactive map, it enables faster decisions, better control, and proactive fleet management.