
The Application Usage report helps administrators identify customer engagement levels by analyzing platform login activity. Based on predefined risk thresholds, companies are categorized into different risk groups, enabling teams to proactively identify inactive customers and reduce churn.
The report classifies companies into the following categories:
- About to Churn – Login percentage below the defined threshold.
- High Risk – Low application usage indicating a high possibility of disengagement.
- Mid Risk – Moderate platform usage.
- No Risk – Healthy application usage and active engagement.
The report also groups companies based on vehicle count:
- Tier 1: More than 50 vehicles
- Tier 2: 11 to 50 vehicles
- Tier 3: 10 or fewer vehicles
Users can drill down into a reseller to view company-level application usage details.
This report is available in Trakzee Lite, Trakzee Standard, Trakzee Premium and Smart Waste management
To open Application Usage Report
- Log in to your account
- Go to Reports → Logs → Application Usage
Filter Explaination
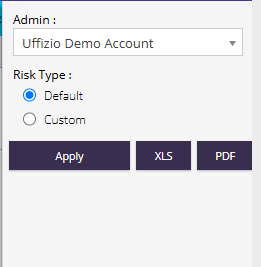
- Admin : The admin account name will be visible.
- Default : Uses the system-defined risk thresholds for categorizing application usage. Default classification:
- About to Churn: Login usage less than 20%
- High Risk: Login usage between 20% and 49%
- Mid Risk: Login usage between 50% and 74%
- No Risk: Login usage greater than 75%
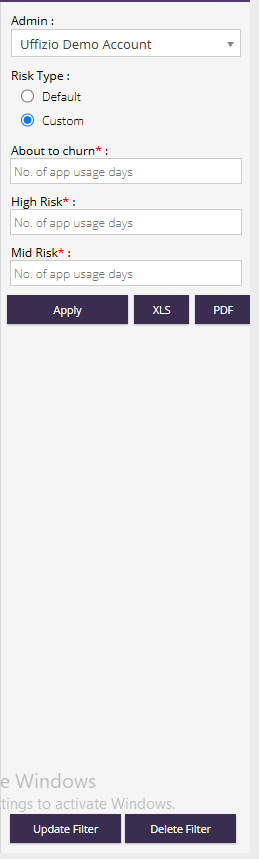
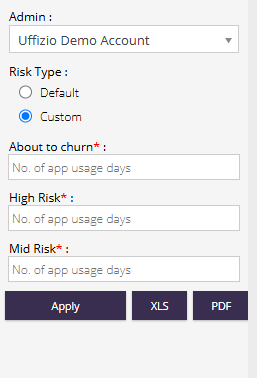
- Custom : Allows users to define their own risk thresholds based on the number of application usage days.
- About to Churn : Specify the maximum number of application usage days that should be classified as About to Churn. Companies falling within this range will be considered at the highest risk of disengagement.
- High Risk : Specify the number of application usage days that should be classified as High Risk. Companies within this range have low platform usage and may require follow-up.
- Mid Risk : Specify the number of application usage days that should be classified as Mid Risk. Companies within this range show moderate platform engagement.
- Apply : Generates the report using the selected criteria.
- Export Options :
- XLS – Export the report in Excel format.
- PDF – Export the report in PDF format.
Report Explanation
Summary View
Displays reseller-wise customer engagement statistics categorized by risk level.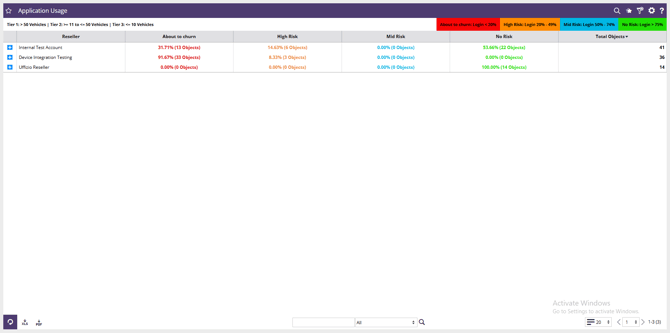
- Reseller : Displays the reseller or account group under which companies are managed.
- About to Churn : Shows the percentage and count of companies with very low application usage. These companies require immediate attention to prevent customer loss.
- High Risk : Displays the percentage and count of companies with low application engagement. These customers may become inactive if corrective action is not taken.
- Mid Risk : Shows the percentage and count of companies with moderate platform usage.These customers should be monitored to improve engagement.
- No Risk : Displays the percentage and count of companies actively using the platform.These customers demonstrate healthy platform adoption.
- Total Objects : Shows the total number of companies or customer accounts included under the reseller.
Detail View
Displays company-wise application usage trends, risk classifications, and active/inactive vehicle information.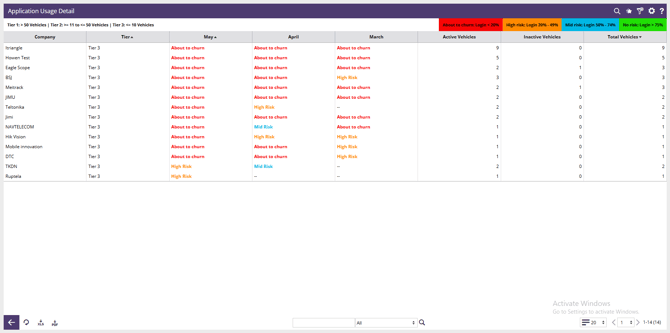
- Company : Displays the company name.
- Tier : Shows the company classification based on vehicle count.
|
Tier |
Vehicle Count |
|
Tier 1 |
More than 50 Vehicles |
|
Tier 2 |
11 to 50 Vehicles |
|
Tier 3 |
10 or Fewer Vehicles |
- Last three month name will be shown in column with risk status calculated for the month
- Possible values:
- About to Churn
- High Risk
- Mid Risk
- No Risk
- Active Vehicles : Shows the number of vehicles actively reporting and using the platform.
- Inactive Vehicles : Displays the number of vehicles that are inactive or not reporting data.
- Total Vehicles : Shows the total number of vehicles assigned to the company.
- Risk Category Legend :
|
Risk Level |
Login Percentage |
|
About to Churn |
Less than 20% |
|
High Risk |
20% – 49% |
|
Mid Risk |
50% – 74% |
|
No Risk |
Greater than 75% |