
When the user clicks on a particular Pet from the pet list, a playback option appears on the top center of the live tracking screen, which displays the playback of the pet for the duration specified by the user.
Please Note: The Live Tracking module on Web is limited to Admin, Reseller & related to subuser's.
Go to Pet tab > Click on pet > Hover on playback to select the desired duration for which to view the playback, as illustrated below:

By clicking on the required timeframe, the playback screen will load, which will be as below:

In the Playback section, users will encounter four distinct bars, tabs, or windows, each serving a specific function, as outlined below:
Settings Bar
The Settings Bar lies in the top center of the playback screen. On this bar, users can find various settings options.

-
Pet Name
When a user clicks on the pet name from the settings bar, the pet list appears on the left side of the screen, as shown below:
From this list, users can choose the pet for which they wish to view the playback.
-
Time Range Selection
When a user clicks on the time range, the different time range options will appear as below:

The playback will be displayed for the duration chosen from the available options.
-
Print Button
By clicking on the
button, the detailed playback report can be printed.

By clicking the Print Map button, you will be able to download the map showing the playback.
By clicking the Print Report button, you will be able to download the detailed textual report.
By clicking the Print Map with Report button, you will be able to download the map with the detailed textual report.
-
Settings Button
By clicking on the  button, the playback settings tab can be easily accessed or hidden as needed.
Playback Settings Tab
The Playback Settings tab appears on the right side of the playback screen.
This tab allows users to choose the information to be displayed on the playback path.
As it can be seen in the image below, features like alerts, inactivity, route, etc., can be checked or unchecked based on preferences. The selected data points will appear on the playback route.
- Stoppage more than
The user must select a duration beyond which stoppage points will be displayed. For example, if 5 minutes is selected, all stoppage points exceeding 5 minutes will appear on the playback. - Speed
The user needs to select either "speed less than" or "speed more than" from the dropdown menu, followed by specifying the speed. For example, if "speed more than 6 km/hr" is selected, the playback will highlight in red the route segments where the pet's speed was above 6 km/hr. - Alerts
The user can choose which alerts to display on the playback.
-
All Alerts: If "All" is selected, all alerts will appear on the playback path at their respective locations.
-
Specific Alert: If a specific alert is selected, only those alerts will be shown on the playback.
-
- InActive
When enabled, this option highlights periods where the pet/device remained inactive (no movement) during the playback timeline. - Route
When enabled, the complete movement path of the pet is displayed on the map during playback. - Data Points
When enabled, individual data points recorded by the device are displayed on the playback route.
Please Note: Enabling this option may impact map responsiveness if there are a large number of data points.
Similarly, all other data points can be displayed on the playback based on the user's selection. Some of these data points are feature-specific.
Playback Bar
The Playback Bar is the bar that appears at the bottom center of the screen. Using the playback bar, various operations can be performed on the playback of the selected pet, such as play/pause, playback speed etc.
![]()
Playback Details Window
The Playback Details Window provides detailed information about vehicle trips, data points received, events that occurred, fuel levels, temperature, speed graphs, and more, including several that are specific to particular features.
This window will appear upon clicking on the upward arrows from the bar in the bottom left corner of the screen. The window can be minimised by clicking the downward arrows.
The bar highlighted in the below image can be used to drag the Playback Detail Window for seeing the expanded version of it.
The below-given tabs will appear as the user clicks on the corresponding icons:
Trips Tab
The Trips tab displays all the trip details of that particular playback. Details like Start/End time and location, distance, speed & alerts are displayed in this tab.

All this trip data can be downloaded in XLS format by clicking on the XLS icon on the right end of the tab, as highlighted in the above image.
Events Tab
The Events tab provides a comprehensive overview of all events that occurred during the playback, including detailed information about their corresponding timestamps and locations. To print these event details, click on the print button on the right end of the tab, as highlighted in the below image.
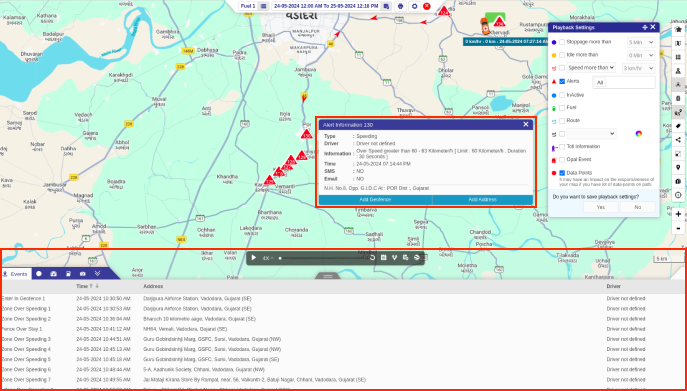
When a user selects a specific event, a popup window will show detailed information about that event on the playback path. This includes details such as event type, timestamp, address, etc., as illustrated in the image above.
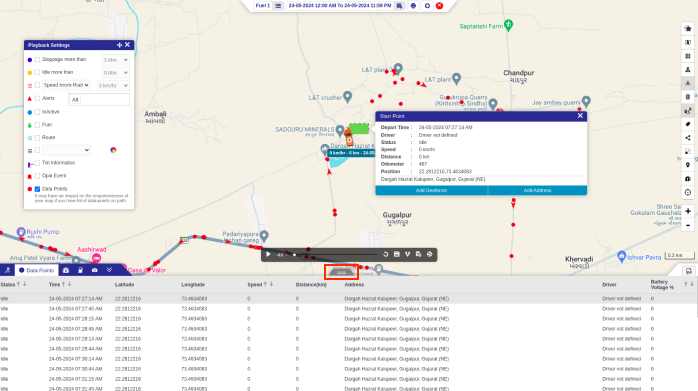
Data Points Tab
The Data Points tab displays all the data points received from the device with details like status of the pet, timestamp, latitude/longitude, speed, distance, and address.
These details can be downloaded in XLS format by clicking XLS and PDF icon on the right end of the tab, as shown below.
.png?width=634&height=327&name=Frame%20654%20(97).png)
The fields such as Time, Status, Speed, and Battery Voltage % include sorting options, allowing users to organize the data as needed for better analysis.
When a user clicks on a specific data point, a new window with detailed information about that point opens, as shown in the above picture.
Speed Tab
The Speed tab offers a graphical representation of the pet's speed over time during the selected playback, allowing users to easily analyze speed trends and variations.

The user can select a particular region on the graph to zoom in and check the detailed graph. By clicking on the refresh button, the graph can be restored to the original view.
By hovering over the lines of the graph, the user can view the detailed speed information along with the precise date and time.
Exit Playback
The User can exit the playback by clicking on the ![]() button on the settings bar.
button on the settings bar.![]()